Product Details:
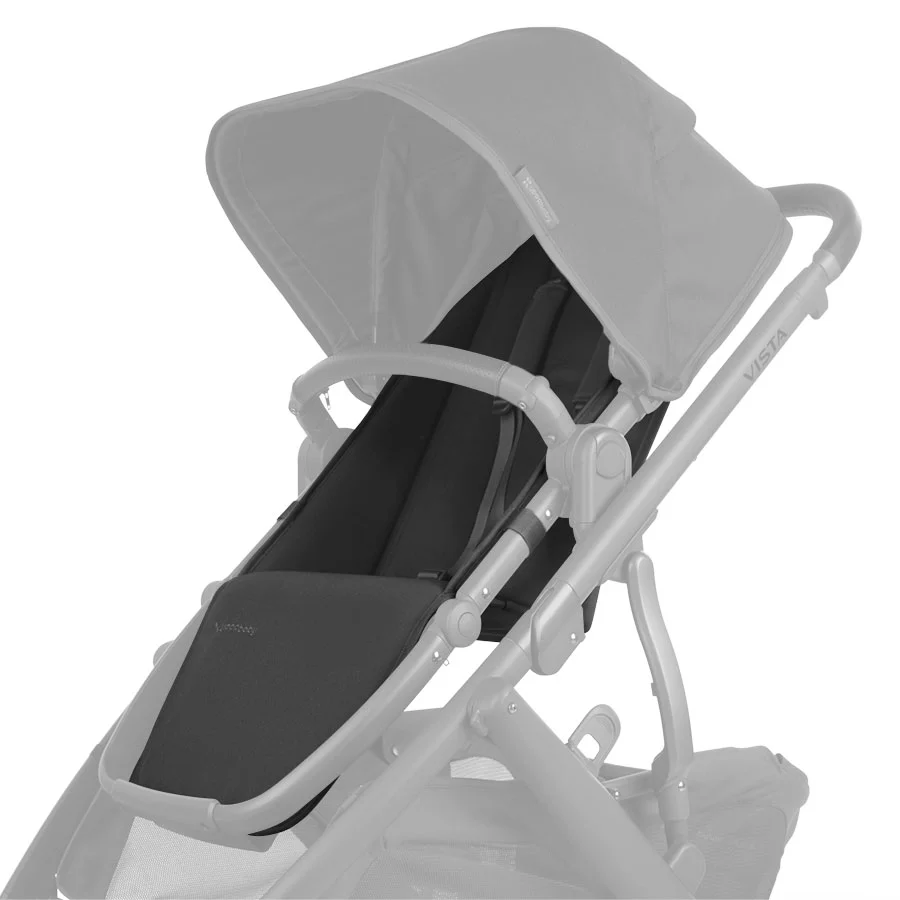
- Compatible with Vista V2, Cruz V2 model strollers
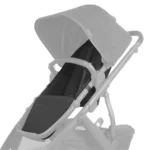
- Does not include seat frame and canopy fabric
- Includes shoulder harness pads

$64.00
$64.00
Free shipping on all orders over $50!
Our customer Experience team is ready to help answer any questions you might have and make sure you order the right part.